The mainstream news media harps endlessly about the perceived benefits of vaccination. It seems nearly impossible to read a news article or listen to a local or national news network on the subject of disease or vaccination without hearing, “the risks of going unvaccinated far out weigh any possible adverse reactions of the vaccine.” This is quickly followed by “vaccines are still the best way to keep you protected from these deadly illnesses.”
In other posts, these adverse reactions are clearly laid out describing how the vaccine is not as benign or uncommon as the media would have you believe. So, just how deadly are these diseases today? You run the risks of adverse reactions to the vaccine because of the fear and supposed knowledge that these diseases are otherwise killing an enormous amount of the population.
Well, below is a T-chart that, unlike proper Accounting practices, does not balance out.
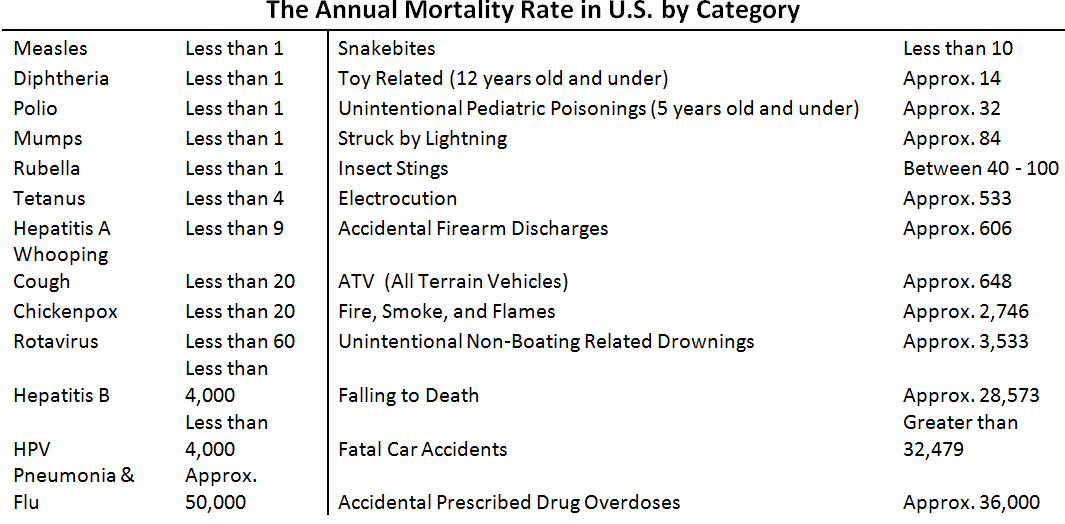
**The sources of the annual death rates on each diseases can be found on that disease’s page by clicking the drop down and selecting “Vaccines and the Virus.” and Non-disease related death sources at the bottom of this page**
If peddling fear and hysteria over these diseases is the correct reaction in order to save lives, then where is the outrage and precaution measures taken to prevent insect stings or unintentional, non-boating drownings? Unintentional, non-boating deaths are nearly identical to that of Hepatitis B in a given year, for example. So, should we be having daily conversations on the safety and efficacy of proper water safety tips, and ensure that all parents and children have take courses and passed tests on these safety tips before entering kindergarten? I don’t think so, but that’s the realty of vaccination culture we permeate in America.
Pediatric Deaths per Category
The below pie chart according to the National Vital Statistics Reports gives some proportionality of children’s deaths between 1 to 9 years of age. Of the diseases that we take extensive measures to vaccinate against, only Flu and Pneumonia are a large enough category (once combined together) to get a sliver of the pie at 1.9%. So, children have a greater chance of dying of cancer, homicide, heart disease, and unintentional injuries, then they do against the vaccinated diseases.

Putting Viruses Into Perspective – Top 5 Premature Death Causes
The top 5 causes of premature death in America are not caused by any of viruses we vaccinate against. If we’re going to put so much focus on these viruses, how much more attention should be paid to these causes?
“Five things kill more people in the United States than anything else: heart disease, cancer, lung disease such as emphysema and chronic bronchitis, stroke and unintentional injuries such as those on roads or caused by medication overdoses. Together, these five conditions cause almost two-thirds of all deaths in the country — nearly 900,000 each year.” – CNN, 2014
“Two in three of those born today are likely to develop cancer, experts have warned, after drawing up stark new scientific forecasts.” – The UK Telegraph, 2015
Non-disease related death Sources:
- “In fact, deaths by snakebite rarely exceed 10 in any given year in this country.” – ABC News, 2008
- Approx. 14 toy related deaths for children 12 years old or younger (2011-2013) – CSPC.gov, 2014 (Consumer Product Safety Commission)
- Approx. 32 “unintentional pediatric poisonings from drugs and other household chemical substances” for children under 5 years old. “Population data for the years 1994 to 2006 were obtained from the U.S. Census Bureau.” – CSPC.gov, 2009
- “Lightning can kill people (3,696 deaths were recorded in the U.S. between 1959 and 2003) or cause cardiac arrest” or an average of 84 deaths annually in the U.S. – National Geographic, 2005
- “there are 40 to as many as 100 deaths annually from insect-sting-related anaphylaxis.” – ABC News, 2009
- Approx. 533 electrocution deaths per year (1990-2000) – CSPC.gov, 2012
- Accidental firearm discharges 600 deaths per year – National Vital Statistics Report (NVSR) “Deaths Final Data,” pg. 23,” 2014
- Approx. 648 ATV (All Terrain Vehicle) deaths per year (2000-2012) – CSPC.gov, 2012
- 2,746 in 2004 Accidental Exposure to Fire, Smoke, and Flames – National Vital Statistics Report (NVSR) “Deaths Final Data,” pg. 24, 2011
- “From 2005-2009, there were an average of 3,533 fatal unintentional drownings (non-boating related) annually in the United States — about ten deaths per day. An additional 347 people died each year from drowning in boating-related incidents.” – CDC, 2014
- 28,573 Falling to death around 30 deaths on average for children 4 years old and under – National Vital Statistics Report (NVSR) “Deaths Final Data,” pg. 23,” 2014
- “The 32,479 traffic fatalities in 2011 were the lowest in 62 years (1949)” – Wikipedia, 2014
- “In 2008, more than 36,000 people died from drug overdoses, and most of these deaths were caused by prescription drugs” – CDC, 2013
